The $5.4 billion, mostly underground Cross River Rail will connect Brisbane’s north to its south.
Brisbane’s new underground Cross River Rail is setting new benchmarks for the federation of BIM, GIS and 3D.
By Russell Vine
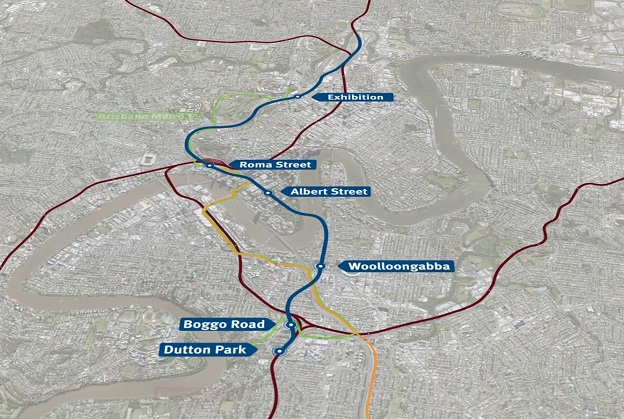
Cross River Rail is a new twin-tunnel, underground rail line that will run under the Brisbane River and Brisbane CBD. It is set to transform the way people travel across the whole of South East Queensland.
Once Cross River Rail is operational, journeys to, from and through Brisbane will be quicker, there will be new stations in more convenient locations, and public transport will become a more viable option for the whole region.
Set for completion in 2024 and with services expected to start in 2025, the $5.4 billion project will create not only four new city-centre underground stations but also a new above-ground station at the city’s iconic RNA Showgrounds.
It also involves a rebuild of six existing stations between Fairfield and Salisbury to the south of the city and delivery of three new stations further south again, on the Gold Coast.
Along the way, the Cross River Rail Delivery Authority (CRRDA) is installing a new world-class ETCS train signalling system and, most notably for this article, it is also responsible for the planning and delivery of precinct development outcomes at each of the project’s five major inner-city station sites.
This precinct planning component is far larger than many people realise, and from the outset has driven an increased focus on above-ground land mapping and GIS than might be otherwise expected for the construction of what is primarily an underground rail line.
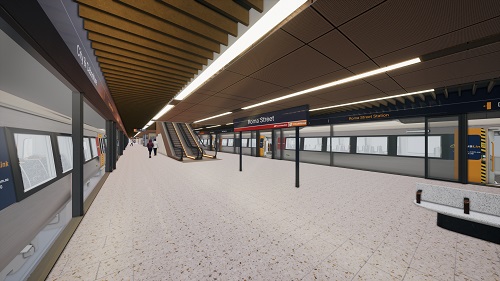
The Cross River Rail project will involve construction of four underground and one new above-ground railway stations. This view of one of the platforms was produced using the project’s VIS model. All images courtesy CRRDA.
Common data environment
At the project’s southernmost Boggo Road station, construction will leave behind nearly three hectares of developable land at the heart of an area that is already a world-class health, science and education precinct.
At Woolloongabba just south of the Brisbane River, a huge 4.5-hectare site that is currently the launch site for the project’s giant tunnel boring machines provides the potential for not only the development of an entirely new town centre but integration also with Brisbane’s iconic Gabba stadium. The latter is a venue that the Queensland Government has recently announced will be completely redeveloped, should Brisbane be successfully appointed as hosts of the 2032 Olympics.
As the project then extends under and north of the Brisbane River, construction of a new station at the corner of Mary St and Albert St will leave behind a prime central CBD land lot.
Then at Roma St on the northern edge of the city, demolition of the tired and unloved Brisbane Transit Centre will create not only potential for new commercial and residential developments on yet another large three-plus-hectare land lot, but the station site has also been earmarked as the preferred site for Brisbane Live. This new 18,000-seat indoor entertainment centre will replace Brisbane’s outdated Boondall Entertainment Centre, located an inconvenient 16 kilometres to the north of the city.
All of this is why, at the outset of project delivery back in 2017, CRRDA realised that the project would have potentially unique needs in respect of correlating its BIM approach to GIS and land mapping. This realisation was exacerbated further once the delivery team started to contemplate how that relationship might also encompass best practice for both 3D digital visualisation and system or information modelling.
To encompass all of these areas in a single exercise, the Delivery Authority has adopted a common data environment and federated model approach. This ensures that not only must multiple major contractors contribute to a single master BIM model, but that the BIM data set is combined with data sets in proprietary GIS platforms — including ‘desktop’ and ‘webmap’ applications — and that the blended BIM/GIS dataset is then used to build and update a ‘real time’ interactive virtual reality, which is built and maintained using game engines.
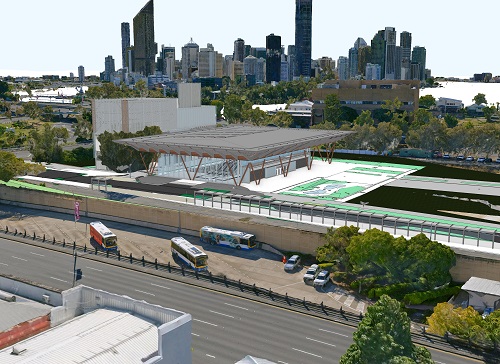
An aerial view from project’s BIM Model showing the new Woolloongabba station.
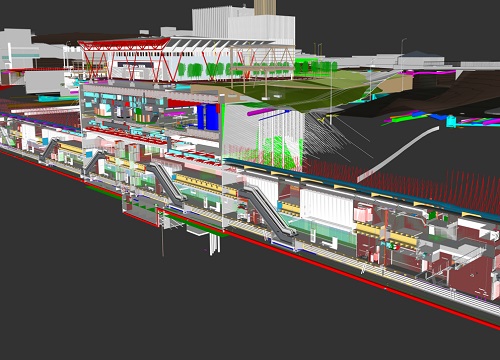
A cross section showing detail of one of the underground stations.
This gamified VR is referred to as the Project’s ‘VIS’ model and uses both 3D digital engineering information as well as 3D geospatial land layers, to enable both visualisation of final infrastructure project outcomes, as well as optioneering of potential wider precinct outcomes.
The approach is referred to by the Delivery Authority as ‘Project DNA’ (ie. Digital Network Approach) and, critically, was an intended project cornerstone prior to any bids for contracts in 2018, with all bidding parties obligated to support Project DNA if successful. And even at a bid stage, they were instructed to provide bid information as per pre-determined BIM and GIS specs.
The move to 3D GIS
With major construction having commenced in 2019 and the project now two years into a six-year build cycle, the benefits of Project DNA are proving to be numerous.
For instance, there is a highly advanced BIM model built across a suite of tools from a range of suppliers (such as ESRI, Autodesk, Bentley and many others) that spans not only three major works packages and 17 kilometres of rail line (both above and underground) but also four underground station interiors modelled down to 2mm detail and updated every four hours.
There are also designs for a further 11 above-ground rebuilds, reconfiguration of two major rail yards and integration with future roads and bus services.
The project’s GIS webmap is equally turbo-charged. It provides not only a traditional 2D map area covering more than 2.2 million hectares of South East Queensland and 514 separate information layers, but also provides an opportunity to test a LiDAR/photogrammetry layer that merges with the 3D BIM data.
This allows the Delivery Authority to ‘tilt’ the GIS view to 3D and then shows the data from BIM coming through into the spatial models. This in turn can be published as 3D webscenes, where future assets can be turned on and the BIM model infrastructure can be contemplated versus current landscape context.
This move to 3D GIS also enables delivery teams to not only utilise GIS for all of the usual project planning purposes (eg. land planning, utilities mapping, clash detection, environmental planning, plotting volumetric land lots etc) but also for the mapping and 3D visualistion/recording of data sets such as archaeology finds, air quality monitors or how each station will integrate back into existing roads, walkways and cycle paths.
Further ‘boosted’ GIS functions now being trialled include pulling real-time data through to a 3D webmap view, which enables the Delivery Authority to better understand and visualise things like tunnelling progress or construction site air quality feeds in a more visual and relevant context.
The project’s heightened interest in modelling information geospatially has also led to the development of a mobile application that enables engineers on site to save images and other construction progress information directly back to the webmap, rather than saving information in traditional server structures or local drives.
This means the project can continue moving to a future where site-specific information is saved geospatially and also creates an opportunity to map information to 3D land visuals.
Virtual delivery
Last but by no means least, there is the ‘VIS’ model output — an interactive, navigable 3D Virtual Brisbane built in Unreal, whereby the Delivery Authority can turn on and explore the future tunnels, stations and precinct buildings not yet constructed.
This is a free-reign, photo-realistic environment, true to BIM model design, drawing on multiple GIS datasets. At a basic level, it enables engineers to contemplate multiple/alternate built environments not yet realised, in the first person and in significant detail.
At the same time it enables the project to share with the public exactly what Cross River Rail will look like, consist of and could yet mean for the city, in a way that is informative, interactive and immersive.
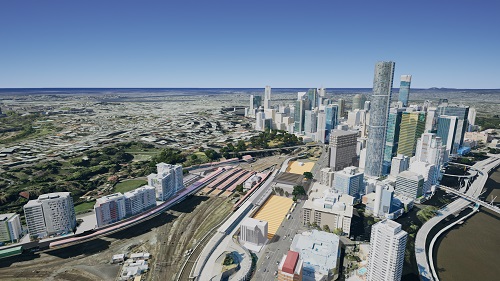
The VIS model shows developable land lots.
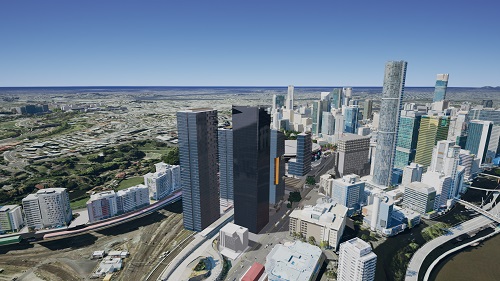
The same model shows potential precinct outcomes.
The Delivery Authority has also pushed the envelope when it comes to the User Interfaces and User Experience for the VIS model. Staff undertake ‘pilot training’ and learn how to spawn into, then fly around, the model using an Xbox controller, which in turn ensures multiple delivery teams regularly fly through the model and can view it on screen in meetings and on an everyday basis.
In addition, the model can be experienced using a standard VR headset and controllers, which enables individuals to be spawned into the future stations at scale and lets them conduct self-guided walking or flying tours anywhere across the full environment.
Better still, the Delivery Authority has also pioneered the use of a 5-way projector system and built a unique ‘mixed reality’ (MR) viewing theatre, where the model environment is projected at scale onto a 2.4m-high, 270° viewing screen. This enables groups of up to 20 people to walk or fly through future stations and future precincts.
This new use of MR is a great example of Cross River Rail’s commitment to innovation in the BIM,GIS and 3D gamification space. It has been universally acclaimed by accessibility groups, emergency services and various architecture, design and engineering communities as a genuine game changer for how teams will be able to benefit from VR models of large-scale infrastructure projects in the future.
Russell Vine is Lead Innovation Officer with the Cross River Rail Delivery Authority and a member of the Delivery Authority’s Executive Leadership Team
This article was first published in issue 113 of Position magazine.
Stay up to date by getting stories like this delivered to your inbox.
Sign up to receive our free weekly Spatial Source newsletter.